
Introduction
In 2020, the office real estate industry saw a big drop in how often tenants used their rented spaces. This change, as shown in [this analysis summary] by Savills, shows that tenants’ needs are changing, which affects the risks landlords face with tenants leaving.
At Square Sense, we tackle these issues by keeping track of how much space is being used and alerting our clients if there is too little or too much usage. These alerts, along with other analyses, help us predict the risk of vacancies. Our goal, as a data-focused intelligence provider, is to help asset managers deal with these changes in tenant behavior.
However, to provide these insights, a property must be digitalized, which can be challenging. This blog post will explain the difficulties involved in this digital onboarding process.
Focus
To understand how office tenants use their spaces, we first need to gather the right data. Analyzing occupancy trends is exciting, but we can’t do it without accurate data, and collecting this data is often harder than it seems.
The data we need includes the measured occupancy in office buildings we’ve onboarded, along with information about the zones and the tenants using them. This data is spread across multiple tables, each created by different people, which can lead to inconsistencies. This is the challenge we will address today.
1. Straightforward Solution
Our problem isn’t too complicated: we receive various data, and our job is to assemble them to make sense. A common issue is that different values, such as asset and tenant names, are written differently in different tables, making it hard to connect the data. These discrepancies can be as small as an uppercase letter in one table and not in another, or as tricky as a name being fully written in one table and shortened in another.
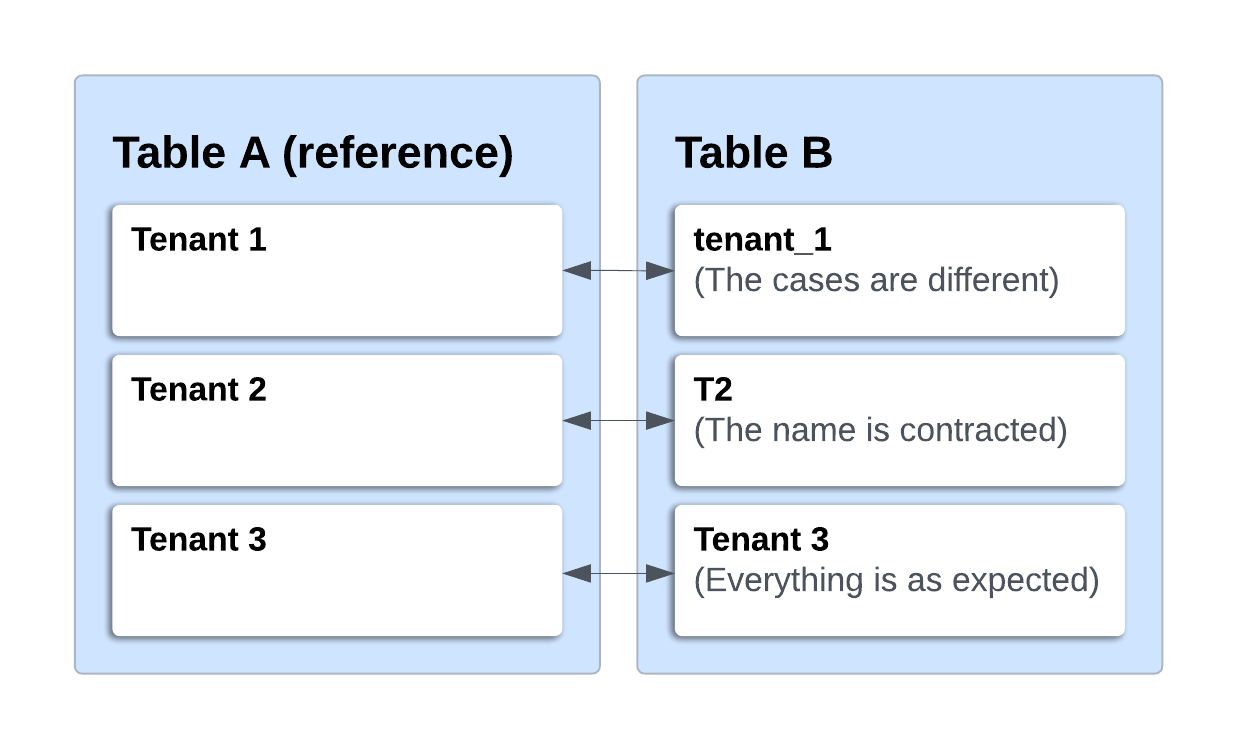
Annexe 1: Examples of the Differences
These differences mean we can’t combine the tables without correcting them. However, when there are not too many discrepancies, they can be fixed manually. For asset names, since we have only a few dozen assets, manual correction is manageable. Our solution was to rename the problematic entries in one table to match the corresponding entries in another table, which we used as a reference. We identified both sets by reviewing the different values. While this solution works, it can be time-consuming
2. Semi-Automatic Method
2.1. Algorithm
Since the problem can occur with multiple assets and we can’t afford operations to take too long as the number of errors increases, we need a better solution: an algorithm.
The idea behind our algorithm is to semi-automatically correct the spelling of tenant names in a given table by comparing them to a reference table.
The steps are:
– Identify tenants that don’t match any reference name. (Automatic)
– Find the best matching candidate in the reference table. (Automatic)
– Validate these candidates. (Manual)
Note: The actual algorithm we use is a bit more complex, but this gives a good overview.
The only tricky step is the second one, but we can get help with it! We assume the best match for each mismatched tenant is the closest one in the reference set. To measure their difference, we use a Python library called textdistance. This library offers over 30 different metrics, allowing us to choose the best one for our needs. For example, a metric like “length” can help us identify if some values are very similar and likely to be the same but with a misspelling. By combining these metrics, we can define a level of similarity between values and identify potential matching candidates.
2.i. Metric
The choice of the metric can’t be left to chance. Different metrics can significantly impact the algorithm’s performance. However, finding the right one is straightforward: we just need to test them! Metrics are classified by behavior, helping us narrow down our options. We focus on “Edit based” algorithms because we think the differences we want to measure are similar to changes made to reference values. This leaves us with eight algorithms to compare.
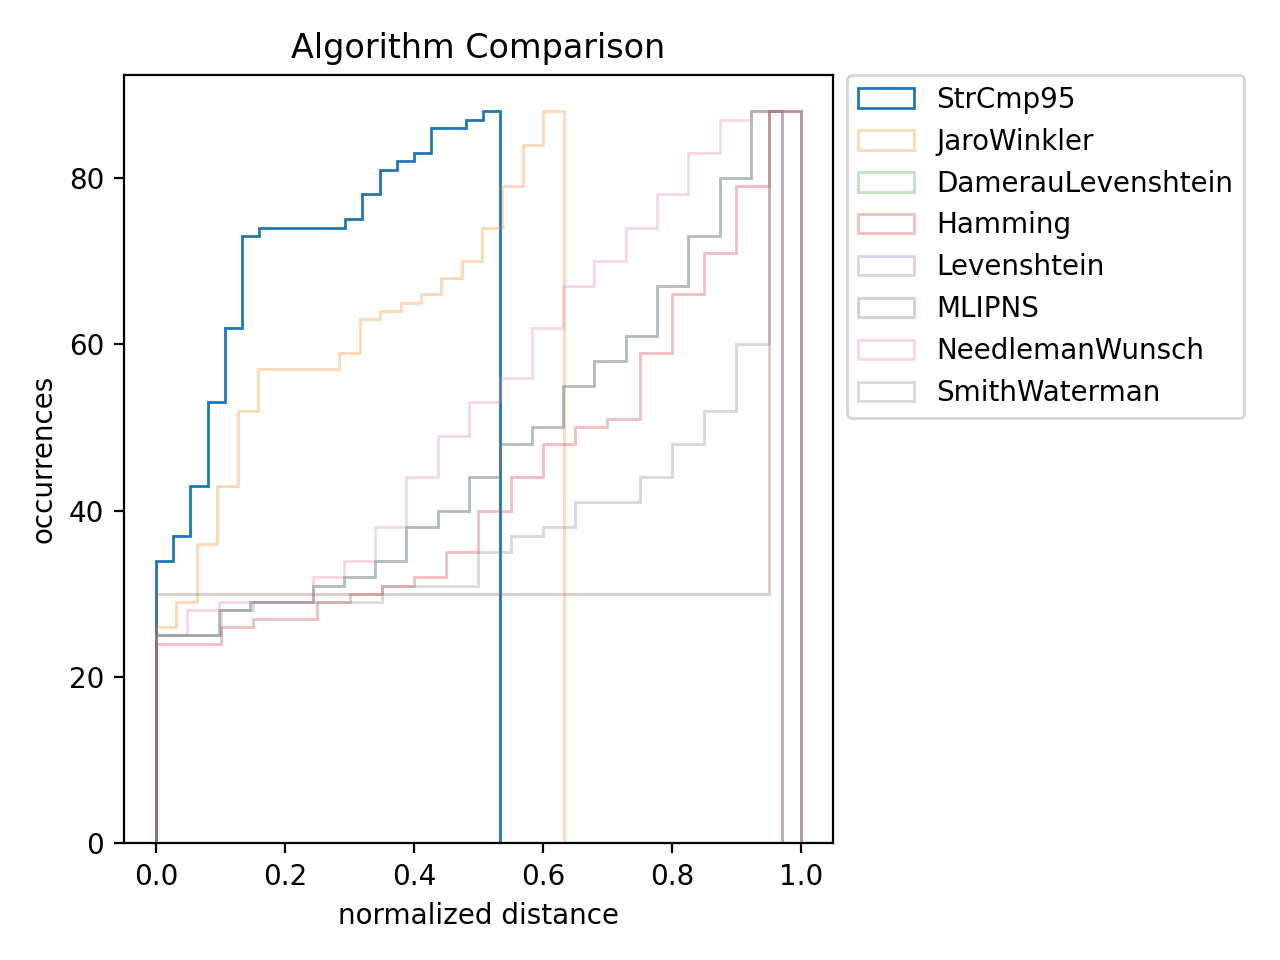
Algorithm Comparison
To compare the algorithms, we observed how well they evaluate manually validated matches. The best algorithm is the one that gives the smallest distances overall.
From the comparison, we see that only two algorithms perform well. Most of them assign distances that are too large for some matches, but there is a clear winner: the StrCmp95 algorithm.
Conclusion
Digital onboarding of properties often encounters inconsistent data. Initially, we corrected discrepancies manually, but this was inefficient. We then developed a semi-automatic algorithm using the StrCmp95 metric from the textdistance Python library, which effectively reconciles tenant name variations.
By solving these onboarding issues, we deliver reliable digital twins and valuable insights, aiding asset managers in adapting to the changing real estate market.
How about delving deeper into this topic?