Understand which amenities and services earn their space

Service Radar is Square Sense's amenity intelligence. It shows how every space in your building is really used, from gym to terrace. Adoption is benchmarked against similar buildings, so owners, operators and investors can decide where capex earns its place.
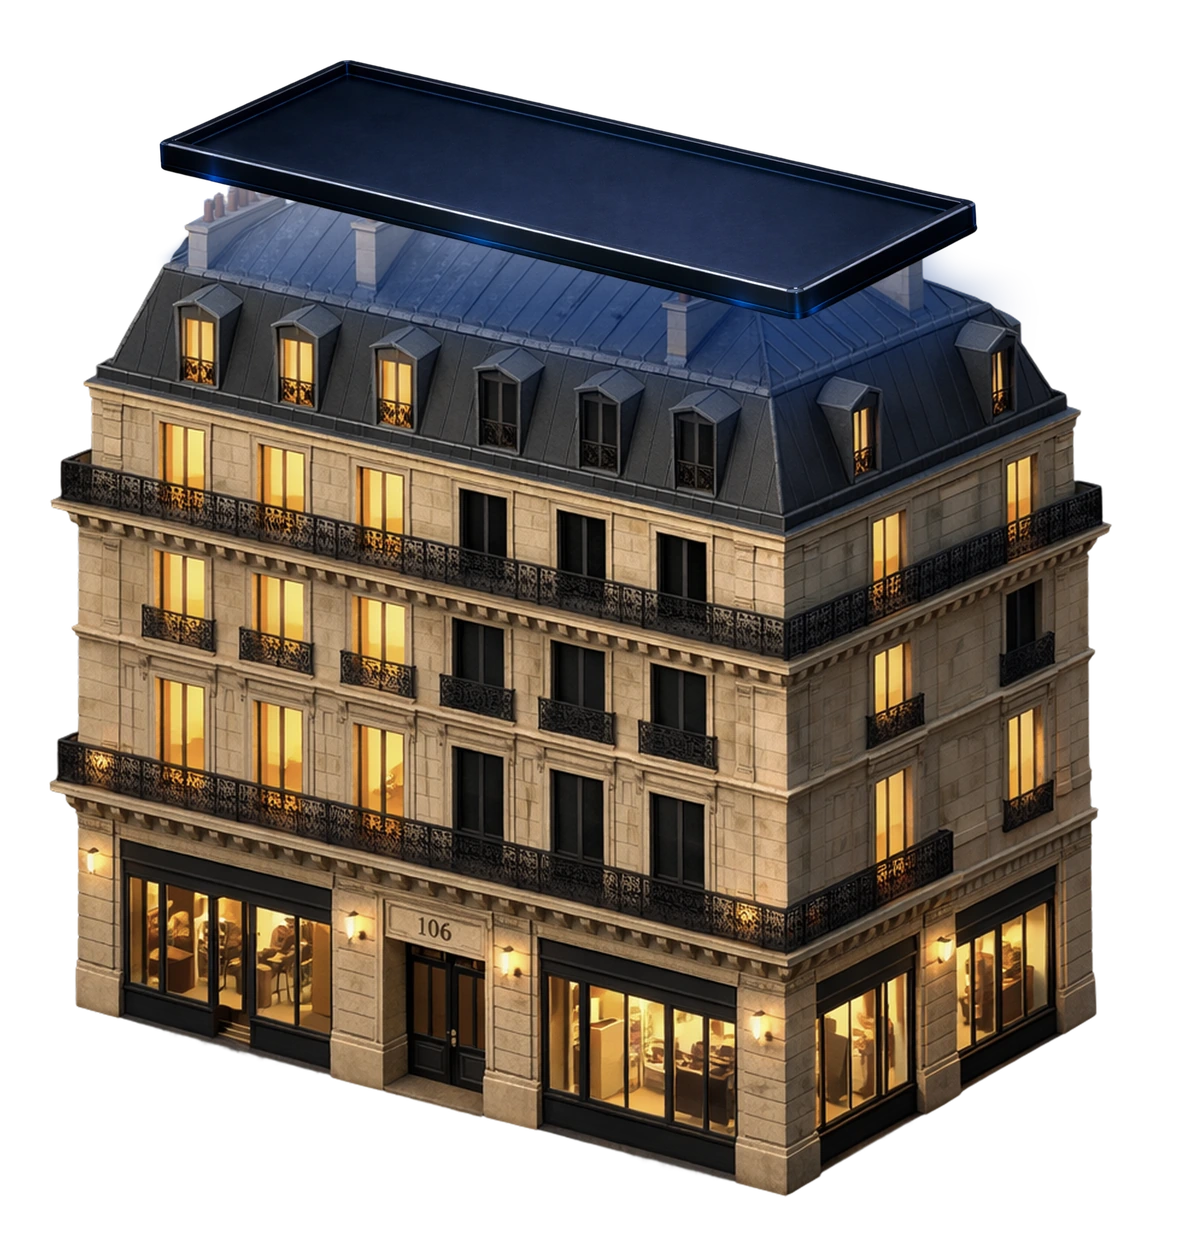
Illustration of a Haussmann-style residential building
Service Radar reports

Amenity adoption, measured by data

Pages from the quarterly report: adoption, peer benchmarks, use by hour and ideas drawn from buildings like yours.

Illustrative data for your building’s services, shown moving as it would in a live report.
Know where your building services standGet started today
Quarterly report · Page 2 Sample
The building and its users: same space, a different mix

Where the building stands this quarter, against its own history and against buildings with a similar user profile.

What we see

Use is level with the Top 30 European cities and the user mix explains most of the quarter's change.

Outlook

A change in who uses the building is likely to keep amenity use lower for now, so the scorecard reads best against peers with a similar user profile.

Weekday use, % of capacity
Sample Building A, this quarter31%Sample Building A, last quarter34%Top 30 European cities33%Expected for this user mix30%
Average weekday use. Illustrative data.
31%weekday use
−3 ptsvs last quarter
+1 ptvs expected for mix
Quarterly report · Page 3 Sample
Adoption scorecard: which services are used and how the space earns its place

Every service in one table, with adoption, the gap to similar buildings and a plain-language judgement.

What we see

Amenity A outperforms similar buildings while Amenity D sees little use.

Outlook

Amenity D is the widest gap to peers, which suggests how it is booked and programmed matters more than demand.

Adoption scorecard
ServiceAdoptionvs peersJudgement
Amenity A41%+6 ptsStrong return
Amenity B27%+1 ptSolid
Service C18%−9 ptsWatch
Amenity D6%−11 ptsUnderused
Service E52%levelSteady
Share of people on site using each service. Peers: similar buildings with a comparable user profile.
41%Amenity A adoption
+6 ptsvs similar buildings
6%Amenity D adoption
Quarterly report · Page 6 Sample
How the building compares with similar buildings, and why

Each measure sits on the range of comparable buildings in the Square Sense panel, with the median marked.

What we see

Two services sit at or above the peer median and two sit below the bottom of the range.

Outlook

The low Service C and Amenity D numbers may reflect how the spaces are booked rather than who uses the building.

Position within the peer range
Amenity A adoption41%Amenity B adoption27%Service C adoption18%Amenity D adoption6%
Dot = this building, bar = peer range, line = peer median. Illustrative data.
2 of 4above peer median
2 of 4below peer range
Latestbenchmark quarter
Quarterly report · Page 11 Sample
Amenity A: popular mid-week, quieter on Fridays

Hour-by-hour use of a single service, so programming and operating costs can follow demand.

What we see

Use peaks from 12h to 13h on Tuesday to Thursday, when the space fills. Friday is half as busy.

Outlook

Friday demand sits at under half of mid-week, so cost per visit is likely to be highest then.

Amenity A use by weekday and hour
8h9h10h11h12h13h14h15h16h17hMonTueWedThuFri
Share of capacity taken at each hour, quarter average. Illustrative data.
92%Wednesday peak
40%Friday peak
12hpeak hour
Quarterly report · Page 9 Sample
Ideas to consider, drawn from buildings like yours

We compare your building with buildings that have a similar user profile. Where an amenity underperforms, we show what is adopted more there.

What we see

Amenity D reaches 6% of people on site in your building, against 17% in buildings with a similar user profile.

Outlook

Buildings with a similar user profile see Amenity F and Amenity B adopted more than others, at 24% and 19%. They are worth testing before investing further in Amenity D.

Amenity D adoption
This building
6%
Similar users
17%
Adopted more by similar users
Amenity F
24%
Amenity B
19%
Adoption: share of people on site. Similar users = buildings with a comparable user profile. Illustrative data.

FOR WHOM

For the people who own, run and fund amenity space

Investors

Underwrite amenity spend and the next scheme on measured adoption, not on assumptions.

Real estate owners

Know which amenities earn their floor area, so capex goes where residents and occupiers actually use space.

Operators

Run cleaning, energy, staffing and programming to real use rather than a fixed schedule and see which activity works.

BY SECTOR

Built for every building with amenities

Student accommodation

See which study rooms, common rooms, gyms and social spaces students use and when, to guide capex and operating decisions across a PBSA portfolio.

Flex living and hospitality

Understand how guests and residents use lounges, spas, gyms and food and beverage areas, so every space earns its place.

Offices and mixed use

Amenity adoption in any building with amenities, from offices and residential to student accommodation and hospitality. For offices with leases, pair it with Tenant Radar.
WHERE AMENITY MONEY IS WON OR LOST

Use cases

Reconversion
Space that never earns its floor area, turned into lettable area or a revenue use.
The next scheme
Behavioural evidence for your next product mix, from data on the buildings you already operate.
Right-sizing
Live and predictive alerts that match cleaning, energy, staffing and security to real use rather than to a fixed schedule.
Programming and events
Which amenities draw adoption on their own, which need animation to work and what that animation should be.

Back your decisions with
tenant and space intelligence

Request a quote
Illustrated office building with green terrace and orange roofIllustrated mixed-use building with blue rooftopsIllustrated office building with a louvred facade and blue roof
FAQS

Service Radar questions

Which buildings is Service Radar built for?

Any building with amenities: offices, residential, student accommodation, flex living and hospitality. For offices with leases, pair it with Tenant Radar.

What decisions does it support?

Reconverting underused space, planning the next amenity scheme and sizing programming, cleaning, energy and staffing to real use.

Where do I start?

Send us your building address and a few details. You receive a quote within two days and your first insights can arrive in as little as 30 days.

How is Service Radar delivered?

As a quarterly report with adoption, peer benchmarks, use by hour and ideas drawn from buildings like yours, plus live and predictive alerts when use departs from the pattern.

How does Service Radar compare my amenities with others?

Each space is compared with similar spaces in comparable buildings, so you see whether a gym, lounge or study room performs above or below its peers rather than judging it in isolation.

Does Service Radar identify who uses a space?

Not individuals, and you do not need them. Service Radar shows the context of use and the type of user, by user group for example, so you can see which amenities work for whom and decide with confidence. We never identify people or touch your users' privacy. Data is processed and stored in the EU and encrypted in transit and at rest. We are fully GDPR compliant and the Data and privacy page gives the detail.

How much does Service Radar cost?

Service Radar is a flat annual subscription, all inclusive. We quote per area monitored with a minimum price per building, so the price follows the spaces you care about. It is flexible, so you can add spaces as you go. Send us your building address and we come back with a quote within two days.

Does Service Radar replace Tenant Radar?

No, they answer different questions. Tenant Radar covers buildings with tenants and leases and gives the outlook on growth, churn risk, resizing and rent revision. Service Radar covers how amenities and services are used, in any building. Offices with leases often use both.

Preferences

Privacy is important to us, so you have the option of disabling certain types of storage that may not be necessary for the basic functioning of the website. Blocking categories may impact your experience on the website.

Accept all cookiesClose Icon

These items are required to enable basic website functionality.

Always active

These items are used to deliver advertising that is more relevant to you and your interests.

These items allow the website to remember choices you make (such as your user name, language, or the region you are in) and provide enhanced, more personal features.

These items help the website operator understand how its website performs, how visitors interact with the site, and whether there may be technical issues.

Thank you! Your submission has been received!
Oops! Something went wrong while submitting the form.
Cookies Icon